
Some studies show that sea levels are rising:
LATEST MEASUREMENT: November 2014 shows a 59.5 mm rise in Sea level which NASA
says is caused primarily by two
factors related to global warming:
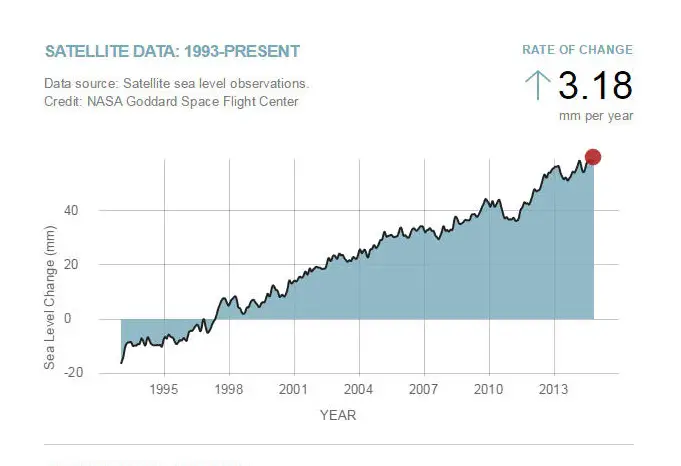
The first chart tracks the change in sea level since 1993 as observed by satellites.
Note: You will see a few news stories and claims that these tables use data fabricated by computer models, but those allegations have been roundly refuted. The need to adjust the data was based on a number of technical changes. In the mid 1980s, the government settled on a list of about 1,200 stations across the country to track temperature trends. Around 1990, climatologists began delivering computer programs to factor in the artificial changes that systematically pushed the readings one way or the other. Over time, they accounted for the impacts of equipment, location, the time of day of measurements and urbanization (more asphalt leads to higher surface temperatures). See this Wikipedia article for the full story.
The second chart, derived from coastal tide gauge data, shows how much sea
level changed from about 1870 to 2000
Here is a link to the data. This file contains Global Mean Sea Level (GMSL) variations computed at the NASA Goddard Space Flight Center under the auspices of the NASA MEaSUREs program.
Ways to save money AND help the environment:
Save water AND money with this showerhead adapter, it lets the water flow until the water is hot, then shuts off water flow until you restart it, ShowerStart TSV Hot Water Standby Adapter

Protect your health with these:
Mattress Dust mite-Bedbug protector, 100% Waterproof, Hypoallergenic, Zippered
Handheld Allergen Vacuum Cleaner with UV Sanitizing for Allergies and Pet, Kills Mite, Virus, Molds, True HEPA with Powerful Suction removes Hair, Dander, Pollen, Dust ,
,
Immune Support Supplement with Quercetin, Vitamin C, Zinc, Vitamin D3
GermGuardian Air Purifier with UV-C Light and HEPA 13 Filter, R emoves 99.97% of Pollutants
HEPA Air Purifier, HEPA Air Cleaner with Washable Pre-Filter, AQI Display, ECO Mode, Sleep Mode, Pet Mode for Pets, Dust, Pollen, Removes 99.97% of Particles, Smoke, Mold, Pet Dander, Dust, Odors
Interesting Reads:
THE PREPPER'S CANNING & PRESERVING BIBLE: [13 in 1] Your Path to Food Self-Sufficiency. Canning, Dehydrating, Fermenting, Pickling & More, Plus The Food Preservation Calendar for a Sustainable Pantry
The Backyard Homestead: Produce all the food you need on just a quarter acre! P aperback
The Citizens' Guide to Geologic Hazards: A Guide to Understanding Geologic Hazards Including Asbestos, Radon, Swelling Soils, Earthquakes, Volcanoes
The Uninhabitable Earth: Life After Warming
Book: The Sixth Extinction:
An Unnatural History Paperback
 .
.